
")
The Head and shoulders chart pattern is a major reliable reversal pattern. This is the most well-known pattern in technical analysis. Head and shoulders chart pattern indicates a possible trend reversal. By identifying this pattern early, we can make an informed decision to enter or exit the market at the right time.
Understanding of Head And Shoulders Pattern:
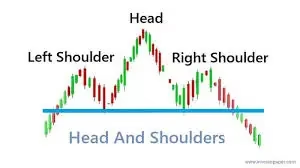
Generally three peaks are found in head and shoulders chart pattern: left shoulder, head and right shoulder. It resembles to our head and shoulder body formation. These three peaks are separated from the two troughs.
- Left Shoulder :- This is the first peak of this pattern. It is formed after the upward move. After reaching this peak the price starts declining.
- Head :- This is the highest peak in this pattern. This is formed when the price has again started to rise following the declining from the left shoulder. After making this highest peak, the price has started declining again.
- Right Shoulder :- This is the third peak of the head and shoulders chart pattern which is lower than the head peak. Generally this peak level is close to the peak level of the left shoulder. If the price breaks the support level (Neckline) after the formation of the right shoulder, this pattern signals a trend reversal.
Neckline, which is the support line drawn through the two troughs formed between the shoulders and the head. The pattern is considered complete when price breaks this neckline.
Types of Head and Shoulders Chart Pattern:
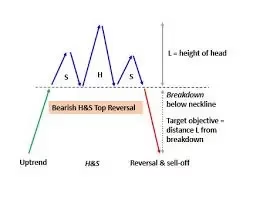
1. Regular Head and Shoulders (Reversal): This pattern indicates a reversal from an uptrend to a downtrend. Generally this is seen at the peak of a long rally.
2. Inverse Head and Shoulders (Reversal): This pattern is the opposite of the regular head and shoulders chart pattern. This indicates uptrend reversal from downtrend. Generally its formation is seen after a long price decline.

How to Use this Pattern:
The head and shoulders pattern is precious because it offers a dependable signal of a trend change. Then is how to use the pattern in trading :-
- Identify the Pattern: The first step is to spot the head and shoulders chart pattern. Look for three distinct peaks the left shoulder, the head, and the right shoulder. insure that the right shoulder is lower than the head, and the neckline is drawn through the two troughs.
- Wait for the Break of the Neckline: The pattern is not verified until the price breaks below the neckline. The neckline is the support line formed between the two troughs. When the price breaks below this position with increased volume, it confirms that the reversal is in stir and that the trend is likely to change from bullish to bearish.
- Set Entry Points: Once the neckline is broken, the coming step is to enter the request. In a regular head and shoulders chart pattern, this means entering a short position after the price breaks below the neckline. In an inverse head and shoulders, you would consider a long position after the neckline break.
- Calculate the Target Price: A common system for setting a target is by measuring the distance from the top of the head to the neckline and also projecting that distance over( in the case of a regular head and shoulders). For an inverse head and shoulders, the same system applies, but you project the distance overhead after the neckline break.
- Place a Stop Loss: To manage monetary loss, it’s important to set a stop loss just above the right shoulder for a short position or just below the left shoulder for a long position. This helps cover your trade in case the pattern fails or the trend reverses suddenly.
- Volume Confirmation: volume is a critical element for attesting the head and shoulders pattern. immaculately, volume should drop during the formation of the pattern( as the price rises and falls). When the price breaks the neckline, volume should increase, attesting the rout.
Practical Example of Using the Head and Shoulders Pattern:
Imagine you’re assaying a stock that has been in a strong uptrend. After a rally, you notice the price forms the following pattern
- A first peak( left shoulder), followed by a withdrawal.
- A alternate peak( head) that’s advanced than the first, followed by another decline.
- A third peak( right shoulder) that’s lower than the head but roughly analogous to the left shoulder.
- Once the price breaks below the neckline( the support position drawn through the two troughs), this signals the end of the uptrend and the morning of a implicit downtrend.
- Entry You could enter a short position after the rout below the neckline.
- Target Measure the height of the head from the neckline and abate it from the neckline’s rout point to determine your target price.
- Stop Loss Place your stop loss above the right shoulder to limit implicit losses in case the pattern fails.
Conclusion:
The Head and Shoulders chart pattern is a important tool in specialized analysis for trend reversals. Whether it’s a regular head and shoulders( motioning a bearish reversal) or an inverse head and shoulders( indicating a bullish reversal), understanding how to spot and trade these patterns can significantly enhance your trading strategy.
By following the crucial way — relating the pattern, staying for a neckline break, setting proper entry points, calculating target prices, and using effective threat operation — you can take full advantage of this classic chart pattern. Flash back, evidence with volume and other specialized pointers can further strengthen your confidence in using the head and shoulders chart pattern in your trading opinions.
Read more: Different types of candles in stock Market
[…] Read More: Head And Shoulders Chart Pattern […]